Navigating the Browse-R
This section provides a tour of the capabilities of the EDB.
Select a dataset
Pick a dataset. Click “make active dataset”. If you don’t see a dataset, add one (see section on adding dataset).
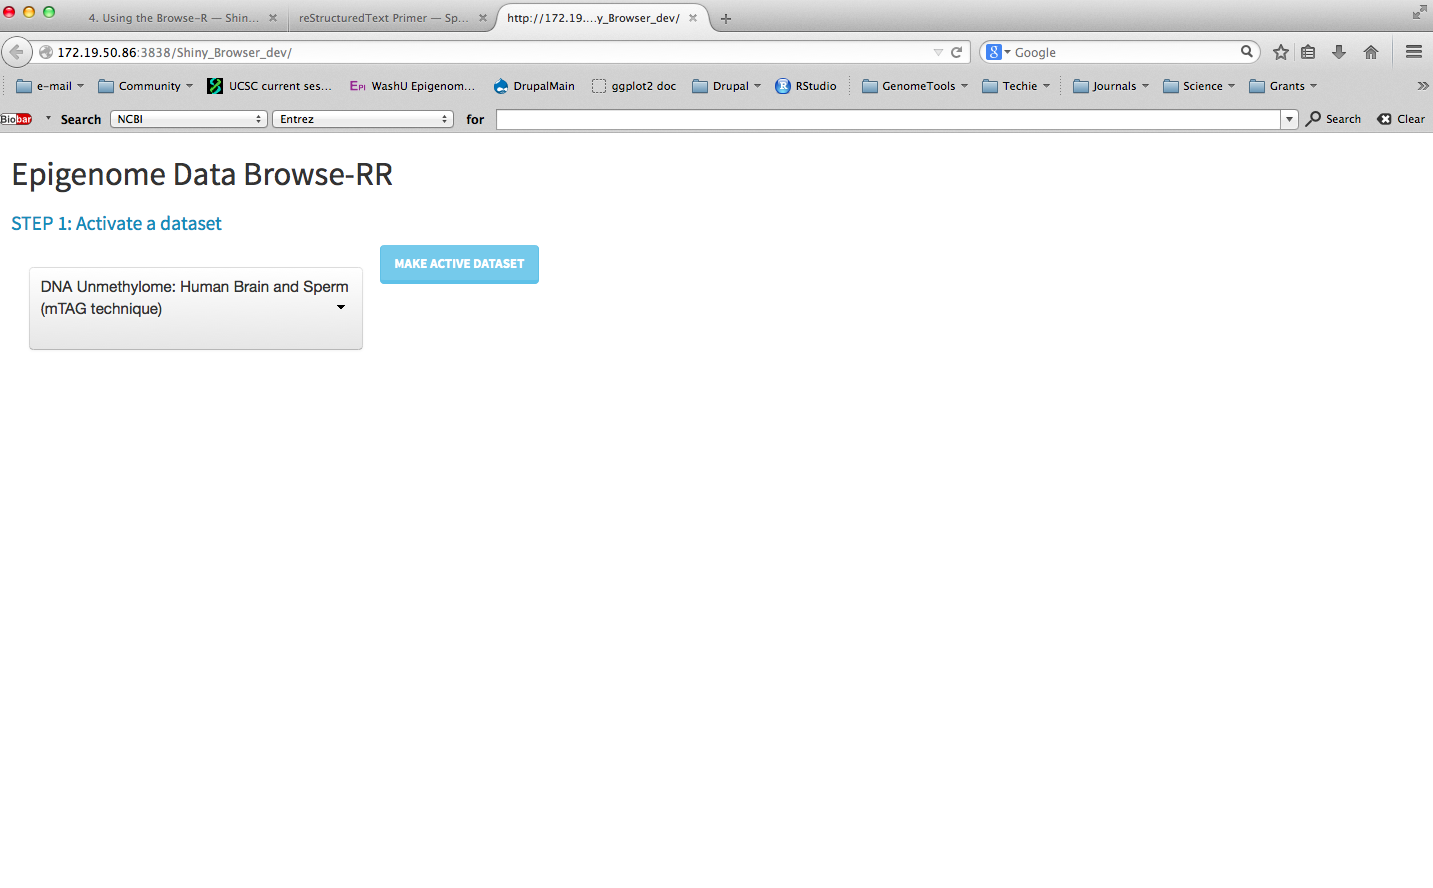
Select a dataset
“Plot settings” panel
The “Plot Settings” panel is the master panel to determine what region of the genome to view, how to bin/smooth/baseline samples, how to group/colour-code samples, and set axes.
Here are the current available options:
Genome Location (left panel)
After updating these values, click the refresh icon for changes to take effect.
| field name | purpose |
|---|---|
| sequence | select from available chromosomes |
| x-range, from/to | coordinates for x-axis units in bp, commas not currently supported |
| Number of Bins: | specifies the number of bins in which the current x-axis is broken up |
| Smooth bw (bp): | smoothing bandwidth (uses Gaussian kernel) |
Data and Grouping
Some of these options result in an automatic refresh. Manually refresh for other options.
| field name | purpose |
|---|---|
| Group samples by | values are those speciifed in dataset group_order file. EDB adds additional value of “(none)” which results in showing sample- level data |
| Baseline trends | sets whether samples are shown as-is, or values are divided by another value. Options are:
Depending on the value of |
Plot Options
These changes result in an automatic refresh and a manual refresh should not be necessary.
| field name | purpose |
|---|---|
| Plot type | Data representation. Options are:
|
| Color by | Setting to color traces. Options include all variables by which samples can be grouped (i.e. those found in
group_order.txt). This mode only works when Group samples by is set to (none). |
| Color scheme | Color palette for determining trace colour. Palettes are from RColorBrewer, which in turn are based on ColorBrewer. Refer to ColorBrewer to pick a palette matching nature of data series (e.g. sequential versus divergent) Note: A number of palettes feature a very light value for the first item in the series. It is advisable to try a few different palettes to make sure all traces are visible. |
| Y-axis | Determines if the y-axis limits are determined by EDB (Default bounds) or by the user (Custom bounds). When Custom
bounds is selected, a slider appears to let the user set limits. |
| show legend | (checkbox) Toggles the legend at the bottom. Legend shows either sample or group names, depending on what individual traces are showing. |
Sample selector
This panel provides a view of the sample phenotype table as provided to EDB.
Rows can be sorted by any column, by clicking the column header at the top.
At present, the sample table only allows selecting of samples, and not deselection. This will change in future versions of EDB.
Samples can be selected using Ctrl-click (or Cmd+<space> in OS X). After selection, click the refresh icon to update the plot view.
Genome Annotation
This panel shows a list of custom genome annotation available for the dataset genome. Refer to this section for instructions to add custom annotation.
Note: The rendering of gene models by Gviz can slow down browser refreshes considerably. EDB automatically switches gene view from ``full`` to ``dense`` mode depending on width of viewed region. However, users are advised to turn on the gene models track, e.g. tracks like *RefSeq genes, only when coordinates are reasonably refined.*